In this piece
Generative AI and News Report 2026: From standalone tools to information infrastructure

A delivery man checks his phone as he rests on his bicycle under the Sydney Harbour Bridge at sunset in Sydney, Australia. REUTERS/Steven Saphore
In this piece
Executive Summary and Key Findings | Introduction | Methodology | 1. The Reach, Use, and Access of Generative AI | 2. AI as an Information Intermediary | 3. What the Public Expect from Different Sectors’Use of AI | 4. Generative AI in Journalism and News | 5. Conclusion | References | About the Authors | Footnotes | AcknowledgementsDOI: 10.60625/risj-9xx8-0k37
Executive Summary and Key Findings
Our survey in nine countries (Argentina, Australia, Denmark, Finland, France, Japan, Norway, the UK, and the USA) explored how people use generative AI in their everyday lives, what they think its impact will be on different sectors of society, and what they think about its use in news and journalism specifically.
It is a follow-up to reports we published based on survey data collected in six of these countries in 2024 and 2025 (Fletcher and Nielsen 2024; Simon et al. 2025).
Based on the results of this survey, and the previous ones, we find the following:
Findings on the reach, use, and access of generative AI
- The use of standalone generative AI systems and chatbots continues to grow rapidly, with weekly use up from one-third (34%) last year to half (51%) in 2026 in the six countries where we have data from previous years.
- Daily use of generative AI systems is increasing rapidly too, nearly doubling year-on-year in these six countries, from 7% in 2024 to 16% in 2025 to 28% in 2026.
- Use of generative AI systems continues to be more common among younger people, as well as those with higher incomes and levels of education, and is also more likely to be used by those in occupations classified as more highly skilled, suggesting that AI adoption is partly driven by certain types of work and workplace integration.
- ChatGPT continues to be the clear market leader, but a number of other systems are growing their user base. Averaging across the six countries where we have past data, ChatGPT increased its weekly use from 22% to 34% (+12 percentage points (pp)), Google’s Gemini has grown from 11% weekly use to 24% (+13pp), Microsoft Copilot grew from 6% to 11% (+5pp), and Claude from 1% to 7% (+6pp).
- Trust in ChatGPT, Gemini, Copilot, and Claude has grown as people become familiar with, and users of, these systems, but large proportions still neither trust nor distrust many of the systems, in part because they are unaware of them.
- Those with higher levels of AI literacy (as measured using the SAIL4ALL scale) are more likely to have heard of different AI systems, but they are not necessarily more likely to use or to trust them – in part because they are more informed about AI capabilities and limitations.
- AI literacy is highest in Finland, Australia, and the UK, and slightly lower in France and Argentina.
- One in ten (10%) say they are paying for access to AI systems, with 9% having access to paid systems via their workplace or school. Together, 18% now have access to paid-for AI systems, which is the same proportion who have access to paid news across the nine countries studied.
- In addition to standalone AI systems accessed directly, people are increasingly likely to see various forms of generative AI integrated into other platforms and services they use – first and foremost in search engines such as Google and Bing, where 57% across countries say they have encountered AI summaries in the last week, but also on smartphones, tablets, or computers (25%), and social media and messaging apps (21%). Much of this is ‘incidental’ AI exposure – coming across AI in services people use for other reasons – and only 20% say they have not seen it anywhere (with a further 9% unsure).
- News media are also drivers of AI exposure, with an average of 24% across nine countries seeing a label saying content was made with AI in the last week, and 20% seeing a bullet-point AI news summary.
- While different AI systems and different forms of generative AI integrated into legacy platforms and services are thus increasingly commonplace and mainstream, the vast majority across all nine countries (67%) did not use an AI agent in the last week, with 14% saying they have used them for a real task and 13% saying they tried one in the last week, but only to experiment.
Findings on AI as an information intermediary
- In terms of what people use generative AI for, getting information is increasingly the most common use case, continuing a trend we documented last year where it overtook media creation. Across the six countries where we have past data, the proportion that say they have used generative AI for getting information in the last week has risen from 11% in 2024 to 24% in 2025 and now 38% in 2026.
- ‘Researching a topic’ (24%) remains the most common use, but people are also increasingly turning to AI for advice (20%), which is now as common as ‘answering factual questions’ (18%). Asking for recommendations is not far behind with 15%. It is also clear that AI is serving a wider variety of people’s needs, with substantial minorities using AI for generating new ideas (14%), summarising text (13%), and seeking support (13%).
- Using AI for news remains a niche activity overall, but it is growing. In the six countries for which we have data from 2024 onwards, it rose from 3% in 2024 to 6% in 2025 and now 9% (8% for all nine countries included in the report).
- Among those who use AI for news, ‘asking a follow-up question about a story’ (49%) is now the most common use case, ahead of ‘getting the latest news’ (46%), which dropped by 8pp compared to 2025 across the six countries where we have past data.
- Most respondents do not have extensive experience of relying on AI systems for information and do not have clear or strong views on the trustworthiness of the output they provide, but looking narrowly at those who do rely on these systems for information, across the nine countries, 75% of those who used AI to answer factual questions trust the answers, as do 76% of those who used it for advice and 72% of those who used it for news, with only small minorities expressing distrust.
- At the same time, trust and trustworthiness do not at this stage seem to be central to why people rely on AI systems – asked for their motivations, respondents tend to see these systems as friction-reducing machines, with the convenience of getting a faster and easier answer named by 64% as the most commonly chosen reason, followed by the interactivity afforded by their natural language interfaces (56%). Only a minority (21%) say that they use them because they get more reliable information from these systems than from other sources.
- As AI systems become more and more widely used, their growing popularity is likely to affect the use of a variety of other existing legacy content offerings and digital platforms and services. People who use standalone generative AI systems are more likely to think that they are using both search engines (-13pp difference between more and less) and news websites (-3pp) less, but the largest proportion say their use of these is about the same.
- People do not generally seem to experience AI chatbots as either so-called ‘echo chambers’ or sources of counter-attitudinal information, with the largest proportion saying the views and arguments they encounter from AI are neither aligned with nor opposed to their own (37%). However, the proportion who say they are aligned (32%) is larger than the proportion who say opposed (13%).
Findings on what the public expect from different sectors’ use of AI
- Across nine countries, people are optimistic about the impact resulting from the use of generative AI by scientists and healthcare professionals, as well as AI companies themselves. They are pessimistic about the impact from governments, social media companies, politicians and political parties – and the news media.
- Opinion varies hugely between those with different levels of AI use. Those who use AI on a daily basis are optimistic about the impact of AI use by almost every sector. However, those that have never used AI are almost universally pessimistic.
- Pessimism about the use of AI by different sectors – including the news media – tends to be driven more by perceived dishonesty about their AI use, and less to do with perceived competence or bad intentions. However, scientists and healthcare professionals are typically seen as competent, good intentioned, and honest when it comes to their AI use.
- In general, people in Argentina and Japan are relatively positive about the impact of AI across almost every measure in the survey, whereas those in the UK and Australia tend to be more negative.
Findings on generative AI in journalism and news
- People remain uncomfortable with the use of AI in the newsroom, especially with the idea of news being made entirely or primarily with AI. On average across nine countries, just 12% say they are very or somewhat comfortable with news made entirely by AI, rising to 19% if there is some human oversight. This has hardly changed since 2024, with views similar across countries.
- People are generally uncomfortable with news content being made with AI regardless of whether it is breaking news or reporting, but are more uncomfortable still with AI being used for commentary or opinion. People are more comfortable with AI being used for tasks like translation and editing spelling and grammar.
- Across six countries, people continue to think that AI will make news cheaper to make (+34pp difference between those that said more and those that said less) and more up to date (+19pp), but also less transparent (-10pp) and less trustworthy (-17pp).
- Despite very pronounced changes in the overall use of AI, and modest growth in the use of AI for news, people’s attitudes about the use of AI in the newsroom have remained broadly stable and negative since 2024.
Introduction
Fears, hopes, and vast amounts of money ride on the development and adoption of generative AI.
In this year’s report we find, for the first time, that half of our respondents are intentionally using dedicated generative AI systems – most prominently ChatGPT – at least weekly. And about seven in ten report encountering AI in increasingly AI-infused legacy platforms, including social media, device operating systems, news media, and, most commonly, search engines – forms of incidental AI exposure that do not depend on choosing to use AI.
The continued rapid growth in intentional uptake, coupled with widespread incidental exposure as generative AI features are built into other services, does not in itself support any particular fear, hope, or commercial bet.
But it does mark a milestone. In less than four years since the public launch of ChatGPT in November 2022 and the AI race that followed, which shows no sign of abating, generative AI has become part of routine life for most people in high-income democracies, at least across the nine countries on five continents that we have surveyed for this report (Argentina, Denmark, France, Japan, the UK, and the USA, all of which we covered in 2024 and 2025, and with Australia, Finland, and Norway surveyed for the first time this year).
Even as both intentional AI use and incidental AI exposure continue to grow rapidly, a significant part of the public remains sceptical of generative AI, and others have not made up their minds. As we show below, many of those who use the most common dedicated AI systems – OpenAI’s ChatGPT and its competitors Google’s Gemini, Microsoft’s Copilot, and Anthropic’s Claude – say they trust them. Intentional generative AI users are thus not only taking up these tools, but are also prepared to rely on them, even as many of their fellow citizens are more reserved. Uptake is just as uneven. AI use is more common in professional occupations than in elementary ones, and those with paid access are more likely than others to use more advanced tools such as AI agents.
And as generative AI is increasingly deployed across different sectors, public expectations around what the impact will be both on their personal lives and on society at large are highly variable, ranging from relatively positive expectations around sectors such as healthcare and science to much more pessimism around the impact of AI when it comes to governments, the news media and, especially, politics and political actors. Here too, users tend to be much more optimistic than the rest of the public, especially non-users – a gap far larger than those between younger and older people or between left and right.
While, overall, generative AI use continues to increase rapidly, its use to get news specifically continues to be relatively uncommon – looking at the six countries for which we have data from 2024 onwards, it rose from 3% in 2024 to 6% in 2025 and now 9% in 2026. This is far fewer than the share who rely on legacy platforms like search engines, social media, or video sharing sites for news, and fewer than go directly to news sites and apps (Egan et al. 2026). That said, compared to individual news brands’ online reach, the 12% in the USA who say they have used generative AI for news in the past week by now rivals the online reach of CNN and the New York Times and, of the brands included in the 2026 Reuters Institute Digital News Report, is behind only Yahoo! and Fox News in terms of online reach (Egan et al. 2026).
Growing use and highly differentiated public attitudes present journalists and news media with evolving challenges. While many users of generative AI systems say they trust them, and some parts of the public are relatively optimistic about what they expect the impact of increased generative AI use will be in some sectors, there is still widespread public caution when it comes to AI use in news – and, as we show below, these attitudes have barely changed in the three years we have been doing this research, despite rapid and dramatic change in many other aspects of people’s relationship with AI.
In the rest of this report, we build on our research from the last two years (Fletcher and Nielsen 2024; Simon et al. 2025) and analyse survey data on the use of, and public opinion towards, generative AI in general and when it comes to news specifically. In the next chapter we describe the methodology the report is based on. As with all survey-based work, it is important to stress that we are reliant on people’s own understanding and recall.
The following chapters cover: first, our findings on the reach, use, and access of generative AI, including AI literacy; second, the emergence of AI as an information intermediary; third, public expectations around different sectors’ use of AI; and fourth, findings on generative AI in journalism and news, followed by a concluding discussion.
We hope the data and analysis we publish here will be useful for media and technology professionals, scholars, and others interested in generative AI and its societal impact.
Methodology
The report is based on a survey conducted by YouGov on behalf of the Reuters Institute for the Study of Journalism (RISJ) at the University of Oxford. The main purpose, as in previous years, is to understand if and how people use generative AI, and what they think about its application in journalism and other areas of work and life. YouGov was responsible for the fieldwork and provision of weighted data and tables only, and RISJ was responsible for the design of the questionnaire and the reporting and interpretation of the results.
The survey and this report are a follow-up to surveys carried out in 2024 and 2025 using the same methodology (Fletcher and Nielsen 2024; Simon et al. 2025). They are both part of the AI and the Future of News project at RISJ.1
The 2026 data were collected by YouGov using an online questionnaire fielded between 14 August and 28 September in nine countries: Argentina, Australia, Denmark, Finland, France, Japan, Norway, the UK, and the USA. Australia, Finland, and Norway were not part of the previous two waves and appear here for the first time. For analysis focusing on trends over time, we use the six countries included in all three survey waves to ensure comparability. Averages across countries are estimates for all respondents in those countries combined, weighted with YouGov’s weights, not the mean of the country percentages.
Samples in each country were assembled using nationally representative quotas for age group, gender, region, education, and political leaning. The data were weighted to targets based on census or industry-accepted data for the same variables. Sample sizes are approximately 2,000 in each country (Table 1). The use of a non-probability sampling approach means that it is not possible to compute a conventional ‘margin of error’ for individual data points. However, differences of +/-2 percentage points (pp) or less are very unlikely to be statistically significant and should be interpreted with a very high degree of caution. We typically do not regard differences of +/-2pp as meaningful, and as a rule we do not refer to them in the text.
Table 1
It is important to note that online samples tend to under-represent the opinions and behaviours of people who are not online (typically those who are older, less affluent, and have limited formal education). Moreover, because people usually opt in to online survey panels, they tend to over-represent people who are well-educated and socially and politically active. This effect is more pronounced in countries with lower levels of internet penetration.
A frequently mentioned concern regarding online surveys has been that users might use AI to fill these out, or that users are not real. Recent research, however, has found that such behaviour is very rare (Gordon et al. 2026; Sehgal et al. 2026) and YouGov employs a range of safeguards to protect data quality, including automated fraud detection, CAPTCHA verification, attention, and AI bot checks, and measures to identify unusually fast or suspicious responses. These checks are applied during fieldwork and data processing to identify and remove potentially fraudulent responses.
Some parts of the survey require respondents to recall their past behaviour, which can be flawed or influenced by various biases. Additionally, respondents’ beliefs and attitudes related to generative AI may be influenced by social desirability bias, and when asked about complex sociotechnical issues, people will not always be familiar with the terminology experts rely on or understand the terms the same way. We have taken steps to mitigate these potential biases and sources of error by implementing careful questionnaire design and testing.
We used ChatGPT 6, Claude Opus 5.5, and Claude Fable 5.1 to assist with the data analysis, copy-editing, and suggesting text. All substantial writing is that of the authors, and we reviewed the manuscript line by line, in addition to a final round of human copy-editing and proof-reading.
1. The Reach, Use, and Access of Generative AI
This year we have seen a continued rapid increase in the use of dedicated AI systems. The proportion who say they use AI systems on a weekly basis rose from one-third (34%) last year to half (51%) in 2026 in the six core countries for which we have data (Figure 1). This means that, since the public launch of ChatGPT in November 2022, it has taken less than four years for the technology to go from being used by almost no-one to half the population in certain high-income countries using it on a weekly basis. For comparison, it took around five years for smartphone adoption in the USA to reach 50% (Pew Research Center 2026), and about seven years for internet use – although the adoption of physical devices differs from the adoption of software that comes layered on top of existing digital media.
Figure 1
Daily use of generative AI systems is increasing rapidly too, nearly doubling year-on-year from 7% in 2024, to 16% in 2025, to 28% in 2026 across the six countries where we have past data. This highlights a shift both to more widespread use and to more frequent use of the technology in 2026.
Growth is also clearly evident when we look at countries individually (see Figure 2), with year-on-year increases in weekly use ranging from +13pp in the USA to +20pp in Japan and +21pp in France. Both Australia (51%) and Finland (48%), two of the new countries we added to the report this year, – have levels of weekly use close to the average. Use in Norway (57%) is slightly higher, second only to Argentina. Weekly use is lowest in the UK (42%), where attitudes towards AI also tend to be more negative than in the other countries studied.
Figure 2
The use of generative AI systems continues to be more common among younger people, as well as those with higher incomes and levels of education. AI is also more likely to be used by those in occupations classified as more highly skilled (level 3 and 4) according to the International Standard Classification of Occupations (ISCO).2 For example (see Figure 3), around two-thirds (64%) of those with professional occupations (e.g. investment analyst, chemical engineer) say they use generative AI weekly, compared to around half (52%) of clerical support workers (e.g. receptionist, travel consultant) and 45% of those with elementary occupations (e.g. domestic cleaner, refuse collector). This highlights that AI adoption is partly driven by certain types of work and workplace integration. The use of AI may effectively be mandatory rather than optional for those in certain types of jobs.
Figure 3
ChatGPT still leads the pack, but Gemini, Copilot, and Claude are also growing
In previous reports we have emphasised that for many people, generative AI is almost synonymous with one AI system in particular – OpenAI’s ChatGPT. In 2026, ChatGPT remains the clear market leader, but the growth we have seen this year is also partly driven by a small group of market challengers.
Averaging across the six countries where we have past data (Figure 4), Google’s Gemini has grown from 11% weekly use to 24% (+13pp),3 Microsoft Copilot nearly doubled from 6% to 11% (+5pp), and Claude rose from 1% to 7% (+6pp). ChatGPT also increased its weekly use from 22% to 34% (+12pp), but relative increases for the other systems are considerably larger, with Copilot and Gemini use doubling, and Claude use increasing seven-fold.
But not every system is growing. Both use and awareness of DeepSeek seem to have stalled after it burst onto the scene in 2025 with a flurry of headlines. Use of Grok, Perplexity.ai, and Meta AI may also be growing, but it is difficult to tell using survey data and such small baseline percentages. Nonetheless, these changes mean that the average number of systems that weekly users regularly access has now increased to two.
Figure 4
Incidental AI exposure: AI in search, devices and news sites
Beyond using AI systems such as ChatGPT directly, people increasingly encounter generative AI in services they already use for other purposes – what research on human–computer interaction calls ‘AI-infused systems’ (Amershi et al. 2019). Some, but not all, of these encounters are deliberate. Borrowing a term from research on news use, we call the latter incidental AI exposure: people come across AI-generated answers or summaries not because they chose to use AI, but because the search engine, phone, or app they are using now provides them.
In our survey, 57% across nine countries say they saw or engaged with AI-generated answers, summaries or assistants in search engines such as Google and Bing in the last week – this is more common than the active use of standalone AI systems (Figure 5). In addition, 25% say they encounter it on their smartphones, tablets, or computers, and 21% on social media or messaging apps, with 20% saying they haven’t seen it at all, and 9% saying they don’t know. These figures include deliberate use of AI features, but they show how far AI now reaches people who have not chosen to use it.
Figure 5
News organisations are a further source of incidental AI exposure. Asking specifically about encounters with AI on the websites and apps of news organisations – which have increasingly started to offer user-facing AI products such as AI news chatbots – about half of people across the nine countries (49%) say they came across at least one AI feature on a news website or app in the last week (see Figure 6). The most commonly noticed feature (24%) is a label for content made with AI, followed by a fifth of people saying they have seen an AI bullet-point summary, with AI news chatbots and AI audio or video versions of articles between 14% and 12%, but 51% said they had seen none of these.
However, these averages hide large differences between countries. In Argentina (67%) and Finland (66%) around two-thirds said they had noticed at least one feature, followed by Norway (59%) and Japan (53%). In the UK only 28% did, with the other countries in between. The UK is lowest on every feature, with only 11% noticing AI summaries and 4% AI audio versions. The leading countries also differ in what people say they have noticed. In Finland and Norway, AI summaries (30% and 31%) and AI labels (36% and 32%) stand out. Argentina, meanwhile, is high across all formats we asked about, including AI video (22%) and chatbots (21%) while in Japan, AI audio versions are unusually prominent (21%).
Figure 6
The most popular AI systems are becoming more trusted
Returning to standalone AI systems, as well as being the most widely used AI systems, ChatGPT, Gemini, and Copilot are also the most widely trusted (see Figure 7). On average across nine countries, ChatGPT is now trusted by 37%, Gemini by around one quarter (27%), Copilot by 18%, and Claude by 13% of people. Although these numbers may seem low, with the exception of ChatGPT, they are conditioned by the large proportion that say they have not heard of each system. All four have larger proportions of trusters than distrusters, meaning that they are trusted on balance. In contrast, DeepSeek, Meta AI, Snapchat My AI, and Grok have both a low proportion of trusters and a slightly larger proportion of distrusters, placing them in the ‘net distrust’ category. However, the gaps are small, again because of the relatively high proportion who have still not heard of these brands. A large part of the public does not have a view on many of these AI systems, because they are not aware of them and have not used them. It remains an open question whether the growing number of users, and people who trust different systems is a trend that will continue, or whether use and scepticism will plateau.
Figure 7
Several AI systems are now more trusted in 2026 than they were in 2025 (see Figure 8). Across the six countries where we have past data, ChatGPT has seen an increase in the proportion who say they trust it, and the difference between the proportion of trusters and distrusters has grown from 12pp to 18pp. The same is true of Gemini (+7pp to +15pp) and Claude (+2pp to +6pp). Only Grok has seen an increase in net distrust (-2pp to -6pp), with all other brands not changing by a statistically significant amount in the last year.
Figure 8
Although increases in trust for the most trusted brands were generally seen across most countries and demographic groups, ChatGPT became less trusted by young people in 2026. On average across six countries, the proportion of 18–24s that trust ChatGPT has decreased and the proportion that distrust it has increased, reducing the net trust score by 13pp (see Figure 9). However, this still means that ChatGPT is trusted overall by the 18–24s, and more trusted than among the over-45s.
Figure 9
A minority are paying for AI themselves, but some get paid access via work or school
Many AI systems now use a subscription model, whereby individuals or organisations can pay to get access to the most advanced models, with older models available for free. Although this is a relatively new development, a minority (10%) across the nine countries included in the survey are currently paying for access with their own money (see Figure 10). However, it is important to point out that a roughly similar number (9%) have paid access via their workplace or school – meaning that 18% in total have access to paid-for AI models. But even so, this still means that most users are still relying on free-to-access versions of the technology and have therefore likely not come into contact with the latest, more capable model versions, so familiar to those on paid plans and those using AI intensely.
The 18% figure is identical to the 18% across these same nine countries that have access to paid-for news according to the 2026 Digital News Report (Egan et al. 2026), though paying for news with one’s own money is more common than paying for AI personally in every country apart from Japan. Interestingly, countries with relatively high levels of paying for news, such as Norway, usually have relatively high levels of paying for AI. Conversely, both France and the UK have relatively low levels of AI and news payment.
Figure 10
AI agents are only used by a minority
For the first time this year we asked people about their use of AI agents,4 generally understood as ‘systems that have the ability to perform increasingly complex and impactful goal-directed action, across several domains, with limited external control’ (Kasirzadeh and Gabriel 2026). Various AI firms have put the development of AI agents at the heart of their strategy: for example, the US-based firm Anthropic is targeting businesses and professional customers with their agentic offerings. Meta also recently released a personal agent, Muse, as did OpenAI with its product called Dots.
To make sure people understood that we were not referring to general generative AI systems or chatbots in our survey, we provided them with a short definition5 (Figure 11). We find that the vast majority of people in all nine countries (67%) did not use an AI agent in the last week, with 14% saying they have used them for a real task, and 13% saying they tried one in the last week, but only to experiment.
Figure 11
Again, we see differences between countries, with people in Argentina reporting the highest use (23%) and rate of experimentation (20%) in line with Argentinians’ higher general use of generative AI described earlier. This potentially reflects a greater enthusiasm for experimenting with AI, alongside economic pressures that may encourage people to seek out tools that can improve productivity and efficiency, although differences in how our respondents understand the term ‘AI agent’ may also play a role. The UK, meanwhile, is the polar opposite, with only 9% saying they have used an agent for a real task in the last week. As with other uses of AI, younger people across countries are more likely to have used an AI agent for a real task, with 26% of 18–24-year-olds versus 7% of those 55 and over having done so (see Figure 12 on previous page).
Figure 12
We also find that the use of AI agents is partly a story about ‘power users’ and rises strongly with how often people use AI, with 32% of daily users saying they have used an AI agent for a real task in the last week, against just 6% of those who use AI less than weekly. Paying for access matters as well, with 39% of those with paid access (whether they pay themselves or get it through work or school) saying they have used an AI agent, compared with 11% of those who only use free versions. The two groups overlap, since many daily users of AI also pay, but the gap holds within the most active group too. Half of daily users of AI with paid access (50%) have used an agent in the last week, compared with 21% of daily users who rely on free tools.
Measuring AI literacy
This year we also attempted to measure people’s AI ‘literacy’ to build a fuller understanding of why people use AI and how they form opinions about it, and to assess whether they can make the most of an information environment shaped by AI.
To do this we deployed the SAIL4ALL measure of AI literacy, developed and validated by Soto-Sanfiel et al. (2025). The scale uses 52 true/false questions with correct answers spread across five dimensions: (i) recognising AI, understanding intelligence and interdisciplinarity; (ii) general vs. narrow AI; (iii) what can AI do?; (iv) how does AI work?; and (v) how should AI be used? This therefore covers both people’s practical understanding and their knowledge of broader issues around the topic, such as the ethics of AI use. Rather than answering all 52 questions, respondents were randomly assigned one question from each dimension, allowing for reliable estimates of AI literacy across the whole sample and various demographic sub-groups. In more technical terms, we used a matrix sampling design (Graham et al. 2006) stratified by dimension for this part of the survey.
It is important to recognise that measuring AI literacy is very challenging for a number of reasons. To begin with, there is no single agreed upon measure of AI literacy, and there is legitimate disagreement over what comprises it. Second, surveys are not ideal for measuring the practical elements of AI literacy (e.g. how people actually use AI). Third, AI literacy is context dependent. Some dimensions may be more important for specific tasks and in specific countries. The SAIL4ALL scale has been validated in the UK, but has not been tested in other contexts. Fourth, AI capabilities are changing rapidly, which means that questions about what AI can do can become outdated quickly. Fifth, ethical questions about how AI should be used necessarily reflect dominant attitudes rather than immutable or objective facts. That said, AI literacy remains an important factor, and this project provides a valuable opportunity to explore the results generated through a widely used AI literacy scale. Nonetheless, the results should be viewed with caution.
On average across nine countries (Figure 13), respondents answered 74% of the true/false questions correctly (across the five equally represented blocks). Although this suggests a high degree of AI literacy, it should be kept in mind that random guessing will score 50% on average. If we split the data by country, we see that respondents score highest on average in Finland, where 79% of the questions were answered correctly, followed by Australia and the UK (77%). Scores were slightly lower in France and Argentina (69%), but overall the differences between countries were small.
Figure 13
Differences between most demographic groups were also small. Averaging across nine countries, all age groups, and both men and women, scored between 73% and 75%. However, there were some differences between levels of formal education, with those educated to degree level scoring above average on 79% (see Figure 14).
Figure 14
The effect of AI literacy on AI use and trust
We can also split respondents into different levels of AI literacy based on how many of the five questions they were asked they answered correctly: low (0–2 correct, 14% on average across nine countries), medium (3–4 correct, 61%), high (5 correct, 25%). When we do this, we see that those with medium and high levels of AI literacy are more likely to use AI systems on a weekly basis (see Figure 15). However, this is chiefly because they are more likely to be aware of each system. If we take away this effect by looking at only those who are aware of each system, we then see that those with higher levels of AI literacy are slightly less likely to use them on a weekly basis compared to those in the low and medium literacy groups.
Figure 15
To some extent we see a similar pattern when we look at trust in AI systems (see Figure 16). People with higher levels of AI literacy are usually more likely to trust AI systems, but when we control for awareness by looking at only those who are aware of each system, the effect disappears, with those with the highest levels of AI literacy trusting AI systems slightly less than those with medium levels.
Figure 16
Those aware of the limitations of AI use and trust it slightly less
We can start to see why this is the case when we look at the separate scores for each dimension of AI literacy (see Figure 17). On average across countries, respondents scored best on questions about ethics (how should AI be used?), answering correctly 84% of the time. They scored worse on questions about the limitations of AI capabilities (what can AI do?), getting just 60% of the questions right. There was little country variation here, but it is noticeable how respondents in Denmark scored relatively well on the limitations of AI (71%), whereas respondents in France and Japan scored around 50% – close to what would be scored by chance.
Figure 17
The ‘limitations of AI’ dimension is key to understanding why those with high levels of AI literacy are slightly less likely to use AI systems and trust them slightly less. Those with the highest level of AI literacy answered every question correctly, including the question on limitations. Therefore, we can see the effect of this question by comparing everyone with medium literacy with those in the medium literacy group who answered the limitations question correctly.
Figure 18
When we do this, we see that those more aware of the capabilities and limitations of AI are a little less likely to use ChatGPT on a weekly basis, and a little less likely to trust it – with the pattern repeated for different AI systems (see Figure 18 above). This suggests that AI literacy is associated with increased awareness of AI systems; however, knowing more about AI’s capabilities and also about its limitations curbs levels of use and trust.
2. AI as an Information Intermediary
One major finding of last year’s report was that using AI for information had become the most popular use case – a trend that continues unabated. Across the six countries where we have past data, the proportion who said they have used generative AI for getting information in the last week has risen from 11% in 2024 to 24% in 2025, and now 38% in 2026 (Figure 19). This means that it has moved further ahead of using AI to create media (31%).
Figure 19
This pattern is replicated across almost all countries, with the partial exception of Argentina, where creating media is roughly as widespread a use case as getting information (see Figure 20). At the same time, we find somewhat more modest growth in using AI for social interaction, which has increased by 3pp to 10%.6
Figure 20
It is important to recognise that although getting information is now the most widespread form of use, using AI for creating media is also growing. As Figure 21 shows, we have seen marked increases in AI use for creating text (from 14% to 20% in the last year) and using it for creating images almost doubled (from 10% to 19%). It is also worth noting that among the under 35s, creating media is as widespread as getting information, with getting information ahead among those aged 35 and over. This could be because using AI to create media (especially images and video) probably requires a higher level of comfort with and awareness of the capabilities of the technology, but it could also be a result of different social practices around images and videos among younger people.
Figure 21
AI increasingly used as a source of information
When we look more closely at what people do when they say they use AI for getting information, we can see that AI is becoming more widely used for the full range of information-related tasks we have been asking about since 2024 (Figure 22), and not just as a way of answering factual questions or as a substitute for search – it is becoming more deeply integrated into people’s everyday information-seeking behaviour.
Figure 22
‘Researching a topic’ (24%) remains the most common use, but people are also increasingly turning to AI for advice (20%), which is now roughly as common as ‘Answering factual questions’ (18%). Asking for ‘Recommendations’ is not far behind at 15%. It is also clear that AI is serving a wider variety of needs, with substantial minorities using AI for generating new ideas (14%), summarising text (13%), and seeking support (13%).
Most of this growth reflects more people using AI overall. Among weekly users, what they use it for has changed less, even though it has shifted here, too. Between 2025 and 2026, asking for advice and getting recommendations grew faster among weekly users than answering factual questions or researching a topic. This trend, and the overall prominence of advice-seeking and support-seeking is particularly interesting here because it suggests that people are using AI systems not just to find and retrieve information, but also to help them make decisions in their lives. For a growing number of people, AI systems are becoming information intermediaries that mediate how they access, interpret, and use information – with those who use AI for these tasks also saying they trust the results.
Across the nine countries, trust in the responses to information-retrieval queries remains high among users (Figure 23). Three-quarters (75%) of those who used AI to answer factual questions say they trust the answers, as do 76% of those who used it for advice and 72% of those who used it for news (see next chapter), with only small minorities expressing distrust.
Figure 23
Among users, trust is slightly lower than a year ago. However, because far more people now use AI, the share of the whole population who use it for these tasks and trust what it tells them has grown: from 9% to 15% for advice and from 9% to 14% for factual questions (see Figure 24). For news – which we will cover in more depth in the next chapter – it is 6%, compared to 4% a year ago. In other words, trust among users has softened a little, but trusted use has reached a much larger part of the public.
Figure 24
AI news use is growing
One specific information-use of AI is for news. The 2026 edition of the Digital News Report, which is based on data collected in early 2026, already found that ‘AI is beginning to play a more meaningful role in news consumption alongside established pathways’ (Egan et al. 2026). Our data from the late summer of 2026 confirm this trend (see Figure 25). While using AI for news remains a niche activity overall, it is growing across countries. In the six countries for which we have data from 2024 onwards, it rose from 3% in 2024 to 6% in 2025 and now 9% in 2026 (8% for all nine countries), with increases across all countries, although slightly more pronounced in some (e.g. Japan) than others (the UK, France).
Figure 25
However, that people use AI for news only tells us so much, with the more interesting question being why they do so. One answer is that AI firms actively encourage some of these uses, as for example Google’s Gemini.
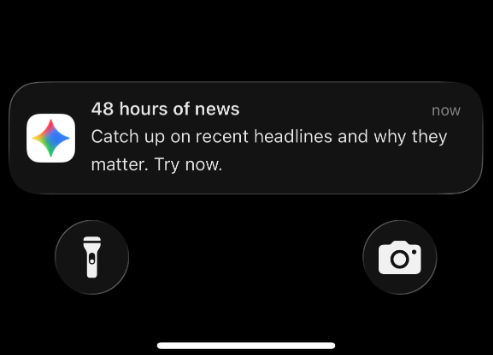
We find that asking follow-up questions about a news story and getting the latest news continue to take the top spots, although the order has changed. Among AI news users in the six countries surveyed in both years, getting the latest news dropped by 8pp in comparison to 2025 (see Figure 26). Many people also report using AI to help them navigate the news; 38% of AI news users have used it to summarise a story and 35% to make one easier to understand. A similar share have used it to find a news source (39%) and to a lesser degree evaluate one (28%). Using AI to turn a news story into another modality, for example a video, continues to remain among the least popular use cases, despite the jump in model capabilities during the same period. For the first time, we also asked if people use AI to get around news outlets’ paywalls in an attempt to read stories they cannot access, with 17% of those using AI for news saying that they have used it for that purpose in the last week – although our data cannot say if they were successful.
Figure 26
Why people turn to AI rather than other options for information
While understanding what people use conversational AI systems for is one part of the story, it also raises the question why they do so – especially why they do so instead of using other media and sources. The answer here (see Figure 27) is that users seem to see them as friction-reducing machines, with the convenience of getting a faster and easier answer – the most commonly chosen reason by 64% (people could select more than one option). This is followed by the interactivity afforded by their natural language interfaces (56%), and the vast amount of aggregated information they bring together (54%) also presents a major draw. Only a minority (21%) say that they use them because they get more reliable information from these systems than from other sources. To use the famous concept from economist Herbert Simon, the pattern seems to be consistent with the idea that people are happy to ‘satisfice’ – with the answers they get ‘good enough’ for their purposes.
Figure 27
This pattern is largely consistent across countries, with the main difference in how many users cite greater reliability of the information as a reason, which ranges from just 12% in Finland and 13% in Denmark to 27% in Argentina and 32% in the USA.
Do people use other sources of information less when they use AI?
If people increasingly value AI because it is easier and faster than searching for information themselves, an obvious next question is whether this is also affecting the sources people use. Consequently, we asked those who use AI for information whether, since they started doing so, they have been using search engines, news websites and apps, and social media more or less (Figure 28). On balance, people say that using AI has reduced their use of search engines, with a clear net shift towards using them less. For social media use, people report a small increase in their use (+3pp), but for news, people report a small decrease overall (−3pp).
Figure 28
Although it is measuring something different, this data broadly aligns with evidence that traffic to news sites and other websites has declined. For example, data from Chartbeat show that Google search referrals to more than 2,500 news sites fell by a third between November 2024 and 2025 (Newman 2026). While these data cannot show that this was caused by AI, it is possible that there is a link. Both a shift of usage from search to AI systems, and the increased integration of AI-generated search engine results leading to fewer clicks could contribute to the decline in traffic to many news sites. Social media, meanwhile, is often used for connecting with others, and algorithmic recommendation, and less for searching for information, which could explain why we see less of a change.
AI systems are not experienced as ‘echo chambers’ by most, but encountering opposing views is rare
Finally, as AI chatbots and tools become an information intermediary for many, a familiar question about digital media has been raised around them too: do they mostly show people views that they agree with? To explore this, we asked people to evaluate the responses they get from chatbots and, for comparison, from search, the news media, and social media – though it is important to underline that this provides data only on what people’s own sense is, and this is not necessarily the same as what is actually happening.
We find that people do not generally seem to experience AI chatbots as either so-called ‘echo chambers’ or sources of counter-attitudinal information (see Figure 29). Across nine countries, among those who use chatbots, the most common answer is that the views and arguments that AI chatbots offer are neither aligned with nor opposed to people’s own (37%). That said, more people say responses are aligned (32%) with their own than opposed (13%), suggesting that people on balance think that chatbots lean towards agreeing with them. But this is no more the case for AI than it is for the other sources we asked about. The balance of aligned versus opposed is the same for news (+20pp for both), smaller than for search (+31pp), and larger than for social media (+12pp) which is where users most often say they encounter opposing views (18%).
Figure 29
The data do not support the idea of a partisan divide; among chatbot users, those on the left (34%) and on the right (36%) are equally likely to see their views reflected. This pattern fits claims made by, for example, Financial Times journalist John Burn-Murdoch and philosopher Dan Williams that, unlike social media, chatbots could pull political conversations towards moderate positions rather than to the extremes.7 At the same time, a sense that what people get from chatbots aligns with what they think may also reflect these systems’ known tendency to agree with users – so-called sycophancy (Ibrahim et al. 2026) – although recent model iterations have been reported to be less sycophantic than older models.8
Figure 30
3. What the Public Expect from Different Sectors’
Use of AI
As generative AI is increasingly used for a wider range of purposes, and by a growing variety of actors, the question of its impact is increasingly mediated by organisational and institutional intermediaries. The implications of, say, OpenAI’s various AI technologies is in part about what the company develops and how millions of individual end users make use of these tools, but also in part about cooperations with partners in different sectors, ranging from its ‘growth deal’ with the UK government under Sir Keir Starmer to its deal with the University of Oxford to its collaboration with the pharmaceutical company NovoNordisk to its partnership with News Corp, and many more.9
Public expectations around the impact of generative AI use by different sectors on their personal life, and society at large
This year, we asked respondents what they think the use of generative AI by ten different societal actors will mean for them individually, and for society at large. These popular perceptions are important in themselves, even though they are not indicators of what the impact actually will be, because our sociotechnical imaginaries are among the factors that influence how technologies are developed and used (Jasanoff and Kim 2015). We asked about nine different important sectors, ranging from formal political institutions (the government, politicians and political parties) to important parts of the private and public sector (banks and financial institutions, health care professionals, law enforcement, scientists) to various kinds of media (news media, social media) and finally AI companies themselves, and use the broad category of ‘ordinary people’ to gauge respondents’ sense of what wider use by members of the public might portend.
Between 54% and 67% of respondents have a view on whether generative AI use in a given sector will impact their lives, or society, either for the better or for the worse. Another quarter to one-third say neither better nor worse, and the rest say they do not know. Keeping in mind that much of the public either do not expect much of an impact either way, or do not have a view on the matter, the net balance between how many respondents expect the use of generative AI will make something better and how many fear it will make it worse provides a way of comparing public expectations across various sectors.
The results are very similar irrespective of whether people are asked how much better or worse they think the use of generative AI by various sectors will make ‘their own life’, or if they are asked the same about ‘society’ (see Figure 31). Looking at the aggregate data across countries we find, at one end, scientists, health care professionals, and the AI companies themselves, where the balance is clearly positive, with more optimists than pessimists. At the other end are news media, the government, social media companies, and, especially, politicians and political parties, where the balance is clearly negative.
Figure 31
Younger respondents (who also use generative AI more) tend to be a little more optimistic in some countries and for some sectors, although the pattern is not consistent. People on the political right, meanwhile, are more optimistic than those on the left, in every country covered.
But the most striking difference is between the intense AI users who say they use one or more tools at least daily (26%) versus those who say they have never used any of the tools we ask about (22%). The intense AI users are consistently much more optimistic about the impact AI will have, whereas those who have never used any of these tools are far more pessimistic (Figure 32 and 33).
Figure 32
Across all countries covered, the balance among intense users is, on average, 49pp more optimistic than among never-users, and across all our respondents, more daily users expect generative AI use will make things better than expect it will make things worse in every sector except party politics. The very significant difference between intense AI users and never-users is in contrast to, for example, much smaller differences elsewhere, with people who are frequent news users somewhat more optimistic than less frequent news users, and the difference by AI literacy as we measure it here is smaller still. Similarly, AI literacy, as we measure it here, also does not seem to relate to expected impact to anywhere near the same degree as active daily use and the accompanying personal experience.
Figure 33
The point of highlighting these results is not to pass judgement on whether optimists or pessimists are right, but to underline the immense gap between how two groups see it: approximately a quarter of the public who are already intense users, and thus draw to a greater extent on personal experience, see the likely impact of generative AI; whereas approximately a quarter who have little or no personal experience of using generative AI do not see the impact in the same way and therefore are more reliant on elite cues, popular culture, opinion leaders in their primary groups, and similar sources. This is important for every sector, including news media and AI companies themselves, but perhaps especially when it comes to collectively binding decisions to use these technologies in parts of the public sector, including education, health, and social care.
In addition to variation across individual respondents, we also see some cross-national variation in topline public expectations when it comes to AI’s impact on society (see Figure 34). Generally, respondents in the UK are much more pessimistic, those in Australia and the USA somewhat more pessimistic, and respondents in Argentina and Japan much more optimistic. The rank order of sectors is broadly relatively similar, with politicians and political parties facing the most public pessimism in every one of the nine countries covered, and healthcare professionals and scientists seeing the most positive expectations in six out of nine countries (rivalled by AI companies themselves in the remaining three countries).
Figure 34
Public perception of the ability, benevolence, and integrity of different sectors’ generative AI use
Beyond the possible role of personal experience, as captured by the very significant difference in expectations between intense users and non-users, what other factors may influence how people judge the trustworthiness of AI and their expectations around the impact generative AI use by different sectors will have on their own life and society at large?
To better understand public expectations, we have included questions in this year’s survey developed on the basis of a tradition of research that highlights the importance of perceptions of ability, benevolence, and integrity as antecedents of trust (Mayer et al. 1995; Schoorman et al. 2007), factors that may also influence people’s expectations of what generative AI use in different sectors may mean.10
The central idea behind the so-called ABI-framework is first, that trusting someone or something necessarily comes with an element of vulnerability (the trust might be misplaced), and second, that willingness to take that risk is related in part to the trustor’s perception of the trustee, especially the latter’s ability (are they able to deliver?), their benevolence (do they have the trustor’s interests at heart?), and integrity (is the trustee honest?). Originating in organisational psychology, this approach has since been widely used in research on communication, media, and information systems (see, for example, Kohring and Matthes 2007; Everett et al. 2026).
While the three different factors can sometimes bleed into one another, and responses to all these questions are highly reliant on what examples come to mind when people are asked about sectors like ‘the news media’, ‘political parties’, or ‘AI companies’, which are often internally heterogenous, the antecedents of trust are important to understand. Previous research on news media has shown how high levels of generalised trust (or lack thereof) can influence both whether people engage with something (e.g. we are often less likely to rely on those we do not trust), and what they in turn take from such engagements (e.g. we are often less likely to believe, and act upon, information from those we do not trust) (see, for example, Strömbäck et al. 2020).
To gauge public perception of ability, benevolence, and integrity across the different sectors covered, we asked three questions. First, whether respondents on balance think each of the sectors is competent or incompetent when it comes to their use of generative AI (ability); second, whether they think each will have good intentions or bad intentions when it comes to their use of generative AI (benevolence); and third, whether they think they will be honest or dishonest when it comes to their use of generative AI (integrity). About 60% of respondents offered an opinion on each of these, with another quarter to one-third opting for the neutral middle option and the rest answering that they do not know.
Responses to the three tend to correlate strongly, and aggregate outcomes are highly correlated with public perception of expectations of the impact of generative AI use in different sectors, raising the possibility that they measure different aspects of a more general and amorphous negative or positive perception of a particular sector. With that caveat in mind, the three different questions still allow us to capture interesting ability-benevolence-integrity profiles for different sectors.
The sectors are arranged in Figure 35 by the net balance of public perception on whether each sector’s use of generative AI will make respondents’ life better or worse, and reporting for each the balance of how many respondents rate the sector in question competent (ability), well intentioned (benevolent), and/or honest (integrity) when it comes to generative AI use, minus how many say the opposite, and a couple stand out. At the pessimistic end of the chart are politicians and political parties and the government, where the public is sceptical of their ability, their benevolence, and their integrity. At the more optimistic end there is high public confidence in both the ability, benevolence, and integrity of healthcare professionals’ and scientists’ use of generative AI.
Across all sectors, there is an honesty problem when it comes to AI. For every one of the ten actors we asked about, fewer people think they will be honest in their AI use than think they have good intentions, and for seven of the ten honesty is also the weakest of all three ratings.
Figure 35
One sector in particular, however, stands out from the general tendency for responses to all these questions to go hand-in-hand, and that is the AI companies themselves (although a similar pattern can be found for social media companies and to some extent news media). While much of the public is confident in these companies’ competence, people are much less optimistic about their intentions and honesty – a public scepticism recognised by at least some industry leaders, judging by Anthropic CEO Dario Amodei’s stated view that AI companies, and many other sectors, face a ‘crisis of trust’.11
4. Generative AI in Journalism and News
This chapter takes a closer look at people’s experiences with and attitudes towards the use of AI in news and journalism. Many news organisations are now using AI for various purposes, and as shown earlier, people’s personal AI use has grown steadily. However, this development has not yet been accompanied by a shift towards greater acceptance of AI-led journalism. Three years into our research, people’s views on this remain remarkably sticky, with the ‘comfort gap’ (Simon et al. 2025) we identified between AI- and human-driven news production largely unchanged from previous years.
People remain uncomfortable with the idea of AI-made news
On average across nine countries, just 12% say they are very or somewhat comfortable with news made entirely by AI, rising to 19% if there is some human oversight. People are more comfortable with news production where humans lead the work, with 45% saying they are comfortable with news made mostly by a human with some help from AI, and 67% saying they are comfortable with news made entirely by a human journalist. If we look at just the six countries for which we have data from 2024 to 2026 (Figure 36), we see that attitudes have barely moved: comfort for news made entirely by a human journalist has grown by 6pp since 2024 (from 58% to 64%), while comfort with news made entirely by AI has stayed at around 12% to 14%. Most of the widening of the comfort gap happened between 2024 and 2025 and has held steady since then.
Figure 36
As in previous editions of this report, this comfort gap can be seen in all countries studied (Figure 37), although it is larger in Finland (72pp) and the UK (70pp) and smaller in Japan (34pp) and Argentina (40pp). In no country does more than one in six people say they are comfortable with news made entirely by AI. We also find that, across countries, young people tend to be more comfortable with AI involvement in any form: 22% of 18–24s are comfortable with news made entirely by AI, compared with 7% of those aged 55 and over. Comfort with news made entirely by a human journalist, by contrast, hardly varies with age (68% in both groups). In other words, young people are more open to AI use in news, without necessarily being any less accepting of human-made news.
Comfort also varies with how much people trust the news. People who trust the news are generally more comfortable with every way of producing it, including AI-led production. On average, 16% of those who trust the news are comfortable with news made entirely by AI, compared with just 7% of those who distrust it. The largest difference, however, is for news made mostly by humans with some help from AI (58% compared with 31%), while 79% of those who trust the news are comfortable with news made entirely by a journalist, against 56% among those who distrust news. To put this differently, people who distrust the news are simply less comfortable with all forms of news production, and the comfort gap is smaller among them (50pp, compared with 63pp among those who trust the news).
Figure 37
Comfort with AI use across different news formats
In our 2024 report (Fletcher and Nielsen 2024) we demonstrated how comfort with AI use in news varies by topic, with people more comfortable with it being used for ‘soft’ news topics, while in our 2025 report (Simon et al. 2025) we showed that people’s comfort also varies with the task for which AI is used, with people more comfortable with the use of AI for back-end tasks such as spellchecks or translation, but much less comfortable with its use to create, for example, an artificial news presenter.
In this year’s edition, we wanted to find out how people’s comfort with AI use varies by news format. Recent months saw a string of cases where news organisations drew criticism for their – at times undisclosed – use of AI for different types of content, with reactions particularly strong around the use of AI for opinion pieces.12 Generally, we find that comfort with news produced mostly by AI with some human oversight depends much more on what AI is used for than on the format that news comes in, with the exception of opinion and commentary (Figure 38). Across all nine countries, around a quarter say they are very or somewhat comfortable with breaking news or live updates (27%), reporting (26%), and satire or humour (26%) produced mostly by AI with some human oversight. The one outlier is commentary or opinion, for which only 22% say they are comfortable.
Figure 38
Looking at only the six countries we surveyed since 2024 (see Figure 39), comfort ranged from 19% to 56% across tasks where AI was used, and 17% to 32% across news topics two years ago, but only from 22% to 26% across formats this year – and for every format, people are more uncomfortable than comfortable across all nine countries, with the gap smallest for satire or humour (−6pp), followed by breaking or live updates (−8pp) and reporting (−10pp).13
Figure 39
As in our data on people’s general comfort with AI use in news, we also find strong cross-country variation here. Japan generally has relatively high levels of comfort with mostly AI-produced news across the different formats we asked about, with the UK sitting at the lower end. And again, a clear pattern is demographic, with younger adults more accepting of AI-produced news across formats than older adults (with 18% of the 55+ group saying they are very or somewhat comfortable with commentary or opinion produced mostly by AI versus 28% of those aged 18–24).
Little change in how people think AI will affect news
Just as in previous editions, we asked respondents whether news produced mostly by artificial intelligence with some human oversight is likely to be more or less trustworthy, easier to understand, transparent, and so forth, compared to news produced entirely by a human journalist (Figure 40).
Figure 40
If we look at the net score for each quality in the six core countries – which is the proportion who said ‘much less’ or ‘somewhat less’ subtracted from the proportion who said ‘much more’ or ‘somewhat more’ – we continue to see clear differences that have changed little since 2024, although there are some notable exceptions. The biggest change is that people have become more likely to think that generative AI will make news easier to understand (rising from +8pp to +14pp, a difference of 6pp), but otherwise there has been little change in how people think AI will affect other news qualities such as accuracy, transparency, or trustworthiness. Looking at all nine countries (Figure 41), what stands out is how strongly people believe that the use of AI will make news cheaper to make (53% vs 14%), although a substantial number say that they see no difference or are unsure.
Across countries, the order of this effect remains broadly stable, even when we include the new countries added in 2026. People in Argentina tend to be the most positive about the impact generative AI will have on news, thinking that it will make most news qualities better, while people in the UK are the most negative in their attitudes, with other countries ranking in between (Figure 41).
Figure 41
What is noteworthy, however, is again how strongly these views differ between those who trust news and those who distrust it (see Figure 42), with the former across countries 18–27pp more positive on every news quality we asked about. Only on trustworthiness are both groups clearly negative (-15pp vs -39pp). While this does not show that trust in news causes this difference, as people who trust institutions are often more positive about most things, it suggests that people’s views of what AI will do to the news cannot be read independently of what they think of the news as an institution.
Figure 42
As argued previously in this chapter, three years into our research we find that people’s views on this topic seem to have calcified for now. People across countries tend to think that generative AI will primarily benefit publishers rather than them as users – although we should be wary of reading this as a rejection of the technology instead of people’s generally more negative attitude towards the news as a societal actor. And, of course, the fact that people’s attitudes have not made a significant turn for the worse either despite the growing prevalence of AI in the news and elsewhere, might also give the news industry some hope that while their use of AI has not improved their fortunes with news audiences, it does not seem to have drastically worsened them either.
5. Conclusion
Our survey data from nine countries document that generative AI use continues to grow rapidly and that, for the first time, half of our respondents are intentionally using dedicated generative AI systems – with more still encountering generative AI features infused in legacy platforms and services, often incidentally.
As we have made clear, this rapid growth in use and enthusiasm in some quarters is accompanied by continued caution towards generative AI from much of the public. While most regular users of various generative AI systems say they trust them, and much of the public is optimistic that increased use of generative AI in sectors such as healthcare and science will benefit both them personally and society at large, many people remain sceptical or undecided, and there is widespread pessimism when it comes to the expected implications of AI use by governments, the news media, and, especially, politicians and political parties.
Compared to last year, trust among generative AI users has softened a little, but because of increased use, the number of trusting users has grown. Looking across public expectations around the impact of generative AI in different sectors, the most striking difference is between the intense AI users who say they use one or more tools at least daily (26%) versus those who say they have never used any of the tools we ask about (22%). The intense users are consistently much more optimistic about the impact they think AI will have, whereas those who have never used any of these tools are far more pessimistic – a gap far larger than that between any other groups we look at.
While many remain undecided or have no strong opinion, there are also sections of the public where attitudes towards and expectations around the impact of generative AI seem to be hardening in an often quite polarised fashion between users and non-users, and to a lesser extent between left and right.
One sector that seems to face a hardening of public attitudes is news. Continued rapid growth in generative AI use and the tendency for users to be somewhat more trusting and optimistic has not changed the overall picture when it comes to news and the comfort gap we have documented in past years – much of the public continues to be sceptical of AI-generated news compared to news produced entirely by a human journalist, and tends to believe that greater AI use by news media will lead to news that is cheaper for publishers to produce but seen as less trustworthy by members of the public. This scepticism towards AI is not unique to news – our data for politicians and political parties suggest even deeper pessimism – but it is also important to recognise that it is not a general rejection of generative AI, as many remain much more optimistic when it comes to other sectors.
For journalists and publishers navigating the rise of generative AI, our findings raise several important questions.
First and most obviously, various forms of generative AI are becoming evermore significant information intermediaries, both when intentionally used and when incidentally encountered. Even if news is not a widespread primary intentional use case at this stage, the impact on news is still real; among the possible knock-on consequences are, as publishers claim based on internal data, fewer search referrals but also, our survey data suggest, more of the public reaching for generative AI systems in place of search engines. One way in which people use AI is to reduce friction by getting a ‘good enough’ output for some information needs while skipping legacy platforms, established publishers, and the time and effort it takes to find the best available information. For most publishers, discovery, brand attribution, data collection, and monetisation are all growing more challenging in this changing context.
Second, even though use continues to grow rapidly and many users trust the AI systems they rely on and often have positive expectations when it comes to what impact generative AI will have in some societal sectors, there continues to be significant public scepticism when it comes to AI in news specifically. For some publishers, this may be an invitation to lean into, and publicise, their commitment to human-produced news. (The sentiment behind the ‘romantic journalism’ manifesto.14) For other publishers who are keen to use AI for their own editorial and other purposes, this repeat finding documents an important challenge around communicating to the public that this is more than a cost-cutting measure (assuming it is) and explaining to people what the benefits to audiences are when publishers use AI.
Third, against a backdrop of generalised scepticism towards AI in news, our data on public perception of the ability, benevolence, and integrity of different sectors’ generative AI use may make for unwelcome reading, with news media seen as barely better than social media companies in terms of their benevolence and integrity, and far less able to use generative AI. But it also helps identify what the profession and the industry, or individual brands, can work on if they want to secure public acceptance of any use of AI (whether acknowledged or unacknowledged) and build positive expectations that this is more than a cost-cutting technology for churning out news more cheaply – namely, establishing their credentials on one or more of these dimensions. The sectors where people have the most positive expectations around the impact of AI both for them personally and for society at large are those that, like AI companies, are very clearly seen in a positive light by a plurality of the public on at least one of these dimensions and, most clearly, those that, like healthcare professionals and scientists, are seen in a positive light on all three. For journalists and news media who believe they are already competent, benevolent, and honest in their AI use, this is a communications issue. (And others may feel that their current situation presents not only communications challenges but also room for improvement, at least when it comes to ability and how it is demonstrated.)
Beyond news, our findings also speak to wider debates about the societal impact of AI. As in other studies on this topic, we find that uptake of AI is uneven, with weekly use more common among people in professional occupations than among those in elementary occupations, and with most people relying on free and therefore less advanced AI models. Such differences in how – and not just whether – people use AI may become a new dividing line, if it hasn’t already. It might also help explain why there is, as AI researcher and OpenAI co-founder Andrej Karpathy recently argued,15 a widening ‘gap in shared understanding of LLM capability’, with most people not seeing what has those inside AI firms – rightly or wrongly – both excited and worried.
Yet, when two groups form very different views of the same technology because they have very different starting points – with expectations of what AI will do differing far more between daily users and people who have never used it than between any other groups in our survey – it is likely not going to be without consequences. This matters not just for people’s individual choices around whether and how to make use of AI in their own lives; it matters particularly where AI is adopted and governed through collective decisions – in public services, for example – that also apply to those who do not use it.
In closing, the parts of our survey that focus on use have documented both rapid continued growth in use of generative AI systems, including not only market leader ChatGPT but also several of its competitors, and beginning use of various forms of agent. At the same time, it has also found relative stability around some public attitudes towards AI, at least when it comes to AI and news.
Increased personal experience of using AI systems is likely to be one of the factors shaping the evolution of these attitudes going forward, but of course far from the only one. Elite cues will also play a role as the politics of AI grow increasingly intense and sometimes polarising, with increasing criticism of data centres, business practices, and energy use, and a cavalier attitude to risk in several countries (even as other political leaders cheer on ‘super intelligence’). Real-world events and how they are communicated and publicised are another factor – recent months have seen several documented instances of so-called ‘rogue agents’, AI system access restricted for security reasons, and calls for technological development to pause amid broader concerns over AI safety. Such incidents might give even the brightest optimist pause.
While not necessarily a full-blown and general crisis of trust, public attitudes towards AI use in most sectors thus continue to look somewhat brittle even in cases where many people are relatively optimistic, as the ‘honesty gap’ documents caution around why different sectors are deploying these technologies – simply to make (or save) money, or also to benefit the public? AI companies certainly face this issue as they develop and deploy their technologies, as do journalists and news media who want to use AI.
References
- Amershi, S., Weld, D., Vorvoreanu, M., Fourney, A., Nushi, B., Collisson, P., Suh, J., Iqbal, S., Bennett, P. N., Inkpen, K., Teevan, J., Kikin-Gil, R., Horvitz, E. 2019. ‘Guidelines for Human-AI Interaction’, Proceedings of the 2019 CHI Conference on Human Factors in Computing Systems, 3, 1–13. Association for Computing Machinery.
- Egan, J., Robertson, C. T., Ross Arguedas, A., Newman, N., Nielsen, R. K., Mukherjee, M., Fletcher, R. 2026. Reuters Institute Digital News Report 2026. Oxford: Reuters Institute for the Study of Journalism.
- Everett, J. A. C., Claessens, S., Knöchel, T.-D., Reinecke, M. G. 2026. ‘Principles for Understanding Trust in Artificial Intelligence’, Nature Reviews Psychology, 5, 388–401.
- Flathers, M., Roux, S., Torous, J. 2026. ‘Beyond Artificial Intelligence Psychosis: A Functional Typology of Large Language Model-Associated Psychotic Phenomena’, The Lancet Digital Health, 8(4), 100974.
- Fletcher, R., Nielsen, R. K. 2024. What Does the Public in Six Countries Think of Generative AI in News? Oxford: Reuters Institute for the Study of Journalism.
- Graham, J. W., Taylor, B. J., Olchowski, A. E., Cumsille, P. E. 2006. ‘Planned Missing Data Designs in Psychological Research’, Psychological Methods, 11(4), 323–43.
- Gordon, A., Rothschild, D., Affonso, F. M., Sulik, J., Hauser, D. J., Pepin, K., Jones, S. 2026. AI Agent Prevalence and Data Quality Across Multiple Online Sample Providers. PsyArXiv.
- Ibrahim, L., Hafner, F. S., Rocher, L. 2026. ‘Training Language Models to Be Warm Can Reduce Accuracy and Increase Sycophancy’, Nature, 652(8112), 1159–65.
- Jasanoff, S., Kim, S.-H. (eds.) 2015. Dreamscapes of Modernity: Sociotechnical Imaginaries and the Fabrication of Power. Chicago: University of Chicago Press.
- Kasirzadeh, A., Gabriel, I. 2026. ‘Agentic Profiles for Effective AI Governance’, Nature, 656(8127), 320–28.
- Kohring, M., Matthes, J. 2007. ‘Trust in News Media: Development and Validation of a Multidimensional Scale’, Communication Research, 34(2), 231–52.
- Mayer, R. C., Davis, J. H., Schoorman, F. D. 1995. ‘An Integrative Model of Organizational Trust’, Academy of Management Review, 20(3), 709–34.
- Newman, N. 2026. Journalism and Technology Trends and Predictions 2026. Oxford: Reuters Institute for the Study of Journalism.
- Pew Research Center. 2026. American’s Use of Mobile Devices. 19 October. Pew Research Center.
- Schoorman, F. D., Mayer, R. C., Davis, J. H. 2007. ‘An Integrative Model of Organizational Trust: Past, Present, and Future’, Academy of Management Review, 32(2), 344–54.
- Sehgal, N. K. R., Tonneau, M., Folk, D., Ungar, L., Guntuku, S. C. 2026. AI-Assisted Submissions in Online Research Are Rare and Highly Concentrated but Routinely Approved. arXiv.
- Simon, F. M., Nielsen, R. K., Fletcher, R. 2025. Generative AI and News Report 2025: How People Think About AI’s Role in Journalism and Society. Oxford: Reuters Institute for the Study of Journalism.
- Simon, F. M., Ross Arguedas, A., Eggert, L. 2025. Reckoning with AI Agents. Oxford: Balliol College.
- Soto-Sanfiel, M. T., Angulo-Brunet, A., Lutz, C. 2025. ‘The Scale of Artificial Intelligence Literacy for All (SAIL4ALL): Assessing Knowledge of Artificial Intelligence in All Adult Populations’, Humanities and Social Sciences Communications, 12(1618).
- Strömbäck, J., Tsfati, Y., Boomgaarden, H., Damstra, A., Lindgren, E., Vliegenthart, R., Lindholm, T. 2020. ‘News Media Trust and Its Impact on Media Use: Toward a Framework for Future Research’, Annals of the International Communication Association, 44(2), 139–56.
About the Authors
Dr Felix M. Simon is the Research Fellow in AI, Information, and News at the Reuters Institute for the Study of Journalism in the Department of Politics and International Relations, a research associate at the Oxford Internet Institute (OII), and a Junior Research Fellow in Politics at Corpus Christi College, all at the University of Oxford. His research looks at the societal impacts of AI, especially its implications for the information environment, the news, and democracy.
Professor Rasmus Kleis Nielsen is a professor at the Department of Communication of the University of Copenhagen and a senior research associate at the Reuters Institute for the Study of Journalism. His research is focused on the changing role of news and media in our societies. He has written extensively about journalism, digital media, the business of news, political communication, misinformation, and related topics.
Dr Richard Fletcher is Director of Research and Deputy Director of the Reuters Institute for the Study of Journalism. He is primarily interested in global trends in digital news consumption, the use of social media by journalists and news organisations, and, more broadly, the relationship between computer-based technologies and journalism.
Footnotes
1 https://reutersinstitute.politics.ox.ac.uk/ai-journalism-future-news
2 https://ilostat.ilo.org/methods/concepts-and-definitions/classification-occupation/
3 In the survey we specifically asked about ‘Google Gemini (not via Google search)’ in order to measure the use of standalone systems. However, despite this, it remains possible that some respondents may have selected the Gemini option after using Google Search’s AI Mode feature.
4 For a primer on AI agents, see Simon, Ross Arguedas, Eggert 2025.
5 The full question was: ‘AI_agentuse. AI agents can complete tasks, not just answer questions in a chat, like a chatbot. An AI agent can take multi-step actions on your behalf, using apps, websites, files, code, email, or calendars. Examples include booking trips, automatically answering emails, or data analysis, etc. Have you used an AI agent (e.g. OpenClaw, Claude Cowork, OpenAI Codex) in the last week for any purpose?’
6 Despite growing reports of so-called forms of ‘AI psychosis’ (Flathers et al. 2026) and worries about unhealthy – however defined – relationships between users and AI systems, we should note that we left it up to our respondents how they defined ‘social interaction’. As a relatively broad category, this will therefore include a range of interaction, from asking a system for personal advice regarding social relationships to more intimate relationships with a system.
7 https://www.ft.com/content/3880176e-d3ac-4311-9052-fdfeaed56a0e?syn-25a6b1a6=1
8 https://www.wsj.com/tech/ai/chatgpt-gpt5-sycophancy-delusions-9b3506bf
9 https://www.gov.uk/government/news/openai-to-expand-into-uk-data-hosting-after-major-growth-deal, https://www.ox.ac.uk/news/2025-03-04-oxford-and-openai-launch-collaboration-advance-research-and-education, https://www.novonordisk.com/content/nncorp/global/en/news-and-media/news-and-ir-materials/news-details.html, https://investors.newscorp.com/news-releases/news-release-details/news-corp-and-openai-sign-landmark-multi-year-global-partnership.
10 Due to limitations to the questionnaire’s length and other questions taking priority, these questions were not asked in Norway, so the aggregate data in this chapter covers eight countries.
11 https://techcrunch.com/2026/08/16/anthropic-ceo-says-ai-backlash-is-fundamentally-a-crisis-of-trust/
12 https://pressgazette.co.uk/publishers/digital-journalism/ai-journalism-mistakes/
13 For the six countries only, the gaps are -5pp (satire or humour), -7pp (breaking or live updates), -8pp (reporting).
14 https://www.journalismfestival.com/programme/2026/a-manifesto-for-the-romantic-school-of-journalism
15 https://x.com/karpathy/status/2109361546505966046?s=20
Acknowledgements
We would like to thank Ben Seddon, Caryhs Innes, David Eastbury, Hannah Moores, Charlotte Clifford, and the rest of the team at YouGov for their work on fielding the survey. We are grateful to the other members of the research and editorial team at RISJ, as well as Michelle Disser, for their input on the questionnaire and help with the interpretation of the results. We also would like to thank the many colleagues and experts who provided feedback on the development of the Generative AI and News Survey 2026, including Marina Adami, Eduardo Suárez, Mitali Mukherjee, Craig Robertson, Jim Egan, Nic Newman, Amy Ross Arguedas, Waqas Ejaz, Collette Brin, Adrian Hadland, Agnes Stenbom, Chris Moran, Matt Rogerson, Ezra Eeman, Erik Bucy, Tess Jeffers, Rubina Fillon, Sacha Altay, Nanne Bos, Ralph Schroeder, Joshua Ogawa, Caspar Llewellyn Smith, David Caswell, Christopher Summerfield, Ekaterina Hertog, Gemma Newlands, Ken Roy, Tellef Rabe, Sora Park and team, the CNTI AI Working Group, as well as contributors from the wider RISJ community and those who answered our online call for feedback – too many to name here individually. We are also grateful to Gretel Kahn, Priscille Bielmann, Eduardo Suárez, Caithlin Mercer, Masaharu Ban, Reiko Sakshi, Salla-Rosa Gröhn, and Ingeborg Vigerust Rangul for their advice on the translations and to Mitali Mukherjee, Kate Hanneford-Smith, Alex Reid, and Rebecca Edwards for helping to move this project forward and keeping us on track.
This report is published by the Reuters Institute for the Study of Journalism as part of our work on AI and the Future of News, supported by seed funding from Reuters News and supported by funding from The National Center for AI in Society (CAISA) in Denmark, the Helsingin Sanomat Foundation in Finland, Fritt Ord in Norway, and the University of Canberra in Australia. The AI and the Future of News project is made possible by core funding from the Thomson Reuters Foundation. This report can be reproduced under the Creative Commons licence CC BY.